Skip to section navigation Skip to main content

Exploring Other Function Models

Test and Confirm

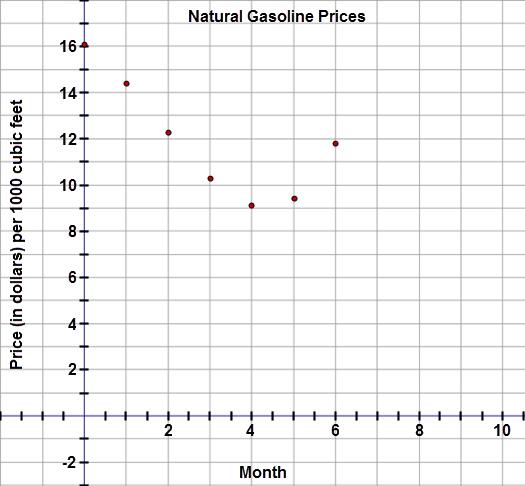
Examine the scatter plot again.

This graph is a scatter plot displaying the price (in dollars) per 1000 cubic feet of natural gasoline over a six month period.  The graph is titled 'Natural Gasoline Prices.'  The horizontal axis is labeled 'Months' and extends from negative 2 to 10.  The vertical axis is labeled 'Price (in dollars) per 1000 cubic feet' and extends from negative 2 to 18.  The graph displays the following ordered pairs:  (0, 16.09), (1, 14.40), (2, 12.26), (3, 10.29), (4, 9.13), (5, 9.41), and (6, 11.78).


Check Your Understanding


< Previous Next >