Just How Normal Are You?
 Resources for this lesson:
You will use your Algebra II Journal ![]() on this page.
on this page.
> Glossary ![]()
> Calculator Resources ![]()
> Teacher Resources: Instructional Notes ![]()

 Check Your Understanding
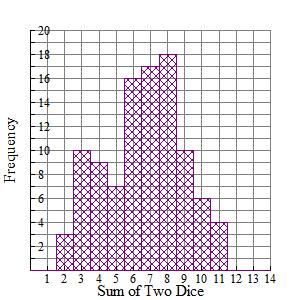
Here is a sample data distribution to show how the sums of the number of pips that appear on the face up side of the number cubes form an approximately normal distribution:
Check Your Understanding
Check Your Understanding
 Algebra II Journal: Reflection 2
Using the graph paper in your Algebra II Journal ![]() or your graphing calculator, sketch the graph of the normal distribution of number cube rolls.
or your graphing calculator, sketch the graph of the normal distribution of number cube rolls.
Check Your Understanding
Check Your Understanding
Check Your Understanding