A Deeper Look at Exponential Functions
 Resources for this lesson:
> Glossary ![]()
> Calculator Resources ![]()
> Teacher Resources: Instructional Notes ![]()
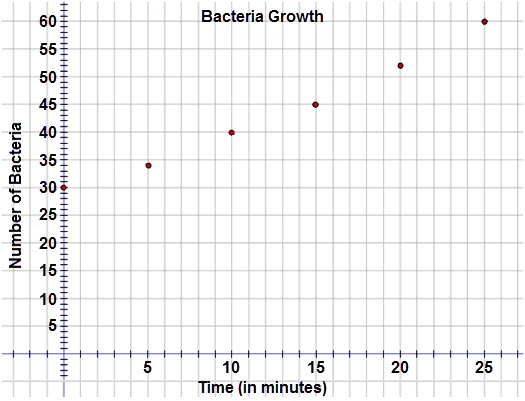
Upon initial inspection of the scatter plot, Khalid believes that a linear model may be the best fit.
 Check Your Understanding