Plinko
 Resources for this lesson:
![]() Key Terms
Key Terms
68-95-99.7 Rule
Empirical Rule
> Glossary ![]()
> Calculator Resources ![]()
> Teacher Resources: Instructional Notes ![]()
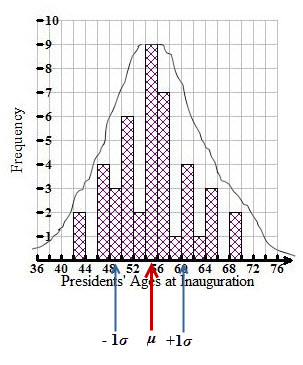
In a normal distribution, the majority of the data is centered about the mean. The "tails" of the curve (the right and left ends) emphasize how the data decreases as you move away from the mean.
Return to the presidents’ ages at inauguration.
Presidents' AgesHide Answer
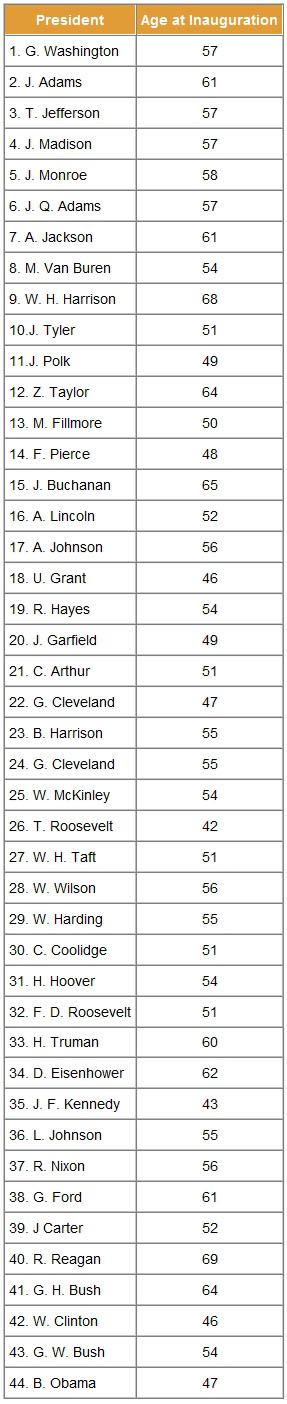 1: G. Washington, 57.
2: J. Adams, 61.
3: T. Jefferson, 57.
4: J. Madison, 57.
5: J. Monroe, 58.
6: J. Q. Adams, 57.
7: A. Jackson, 61.
8: M. Van Buren, 54.
9: W. H. Harrison, 68.
10: J. Tyler, 51.
11: J. Polk, 49.
12: Z. Taylor, 64.
13: M. Fillmore, 50.
14: F. Pierce, 48.
15: J. Buchanan, 65.
16: A. Lincoln, 52.
17: A. Johnson, 56.
18: U. Grant, 46.
19: R. Hayes, 54.
20: J. Garfield, 49.
21: C. Arthur, 51.
22: G. Cleveland, 47.
23: B. Harrison, 55.
24: G. Cleveland, 55.
25: W. McKinley,54.
26: T. Roosevelt, 42.
27: W. H. Taft, 51.
28: W. Wilson, 56.
29: W. Harding, 55.
30: C. Coolidge, 51.
31: H. Hoover, 54.
32: F. D. Roosevelt, 51.
33: H. Truman, 60.
34: D. Eisenhower, 62.
35: J. F. Kennedy, 43.
36: L. Johnson, 55.
37: R. Nixon, 56.
38: G. Ford, 61.
39: J. Carter, 52.
40: R. Reagan, 69.
41: G. H. Bush, 64.
42: W. Clinton, 46.
43: G. W. Bush, 54.
44: B. Obama, 47.
1: G. Washington, 57.
2: J. Adams, 61.
3: T. Jefferson, 57.
4: J. Madison, 57.
5: J. Monroe, 58.
6: J. Q. Adams, 57.
7: A. Jackson, 61.
8: M. Van Buren, 54.
9: W. H. Harrison, 68.
10: J. Tyler, 51.
11: J. Polk, 49.
12: Z. Taylor, 64.
13: M. Fillmore, 50.
14: F. Pierce, 48.
15: J. Buchanan, 65.
16: A. Lincoln, 52.
17: A. Johnson, 56.
18: U. Grant, 46.
19: R. Hayes, 54.
20: J. Garfield, 49.
21: C. Arthur, 51.
22: G. Cleveland, 47.
23: B. Harrison, 55.
24: G. Cleveland, 55.
25: W. McKinley,54.
26: T. Roosevelt, 42.
27: W. H. Taft, 51.
28: W. Wilson, 56.
29: W. Harding, 55.
30: C. Coolidge, 51.
31: H. Hoover, 54.
32: F. D. Roosevelt, 51.
33: H. Truman, 60.
34: D. Eisenhower, 62.
35: J. F. Kennedy, 43.
36: L. Johnson, 55.
37: R. Nixon, 56.
38: G. Ford, 61.
39: J. Carter, 52.
40: R. Reagan, 69.
41: G. H. Bush, 64.
42: W. Clinton, 46.
43: G. W. Bush, 54.
44: B. Obama, 47.
 Check Your Understanding
Notice that the majority of the data falls between − 1 and + 1.
Check Your Understanding
In a perfect normal distribution, 68.26% of the data should fall within one standard deviation of the mean. The presidential ages are an approximately normal distribution, so you should have arrived at approximately 68.26% in your last answer.
Below is a normal curve, showing the distribution of the data. The curve is a function showing the frequency of the data values with respect to its distribution.
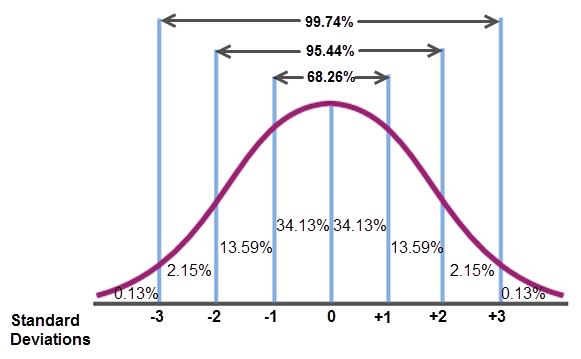
The 0 marks where the mean, μ, is. As you can see, in the population percentage, 68.26% of the data will fall within one standard deviation of the mean (μ ± 1), 95.44% of the data will fall within two standard deviations of the mean (μ ± 2), and 99.74% of the data will fall within three standard deviations of the mean (μ ± 3). This is commonly referred to as the 68-95-99.7 Rule or the Empirical Rule.