Teacher Resources
Making Deviation Standard
On this page you will find lesson objectives, standards, instructional notes and UDL opportunities.
Estimated Time: 90 minutes
 Lesson Objectives:
- The students will describe and analyze sets of data using the mean and mean absolute deviation.
- The students will describe and analyze sets of data using the mean and standard deviation.
- The students will compare and contrast mean absolute deviation and standard deviation.
Key Common Core State Standards:
S.ID.4: Use the mean and standard deviation of a data set to fit it to a normal distribution and to estimate population percentages. Recognize that there are data sets for which such a procedure is not appropriate. Use calculators, spreadsheets, and tables to estimate areas under the normal curve.
Supporting Common Core State Standards:
6.SP.5c: Giving quantitative measures of center (median and/or mean) and variability (interquartile range and/or mean absolute deviation), as well as describing any overall pattern and any striking deviations from the overall pattern with reference to the context in which the data were gathered.
S.ID.2: Use statistics appropriate to the shape of the data distribution to compare center (median, mean) and spread (interquartile range, standard deviation) of two or more different data sets.
S.ID.3: Interpret differences in shape, center, and spread in the context of the data sets, accounting for possible effects of extreme data points (outliers).
Standards for Mathematical Practice Emphasized:
1. Make sense of problems and persevere in solving them.
2. Reason abstractly and quantitatively.
4. Model with mathematics.
5. Use appropriate tools strategically.
Instructional Notes:
In this module, the students will work alongside the characters Andrew and Khalid as they look at mathematical characteristics of the presidents of the United States. This application of American history will be a recurring theme throughout the module, but each lesson is self-contained.
For the first lesson, the students begin by reviewing mean absolute deviation as a measure of variability. The new learning for the students will begin with standard deviation and understanding the difference between mean absolute deviation and standard deviation. This is critical for students who plan on advancing into higher level statistics courses.
Many of the calculations in this module will be done using the graphing calculator. Where appropriate, the steps to utilize the calculator will appear in the Student Lesson pages of the module as well as in the Student Resources. The students may use other technology tools to perform the necessary calculations. For example, Excel software contains spreadsheets and formulas that will perform the same calculations and graphics. The first two modules have the students using the Shodor Applet ![]() . There is no direct applet for the calculations the students need to make in this lesson. However, there are many teacher resources (such as lesson plans and discussions) that may prove useful when planning this lesson.
. There is no direct applet for the calculations the students need to make in this lesson. However, there are many teacher resources (such as lesson plans and discussions) that may prove useful when planning this lesson.
While this lesson applies the concepts of mean and standard deviation to historical references, there are multiple science and technology applications for these topics that are easily accessible through Internet and text resources. Review the mathematical tasks available at Illustrative Mathematics ![]() . Available through the High School Statistics and Probability link are several STEM-related tasks that the students can complete.
. Available through the High School Statistics and Probability link are several STEM-related tasks that the students can complete.
> Go to Making Deviation Standard lesson
Sample Responses
For sample responses to the Algebra II Journal questions, visit the Algebra II Journal in the Teacher Resources.
Making Deviation Standard - Page 1
In this lesson, students begin by reviewing Mean Absolute Deviation as a measure of variability. The new learning for students will begin with Standard Deviation and understanding the difference between Mean Absolute Deviation and Standard Deviation. This is critical for students who plan on advancing into higher level statistics courses.
Making Deviation Standard - Page 7
At this point, in a fifth step, the students would be introduced to summation notation. Standard deviation can be summarized as
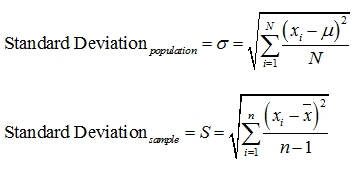
Symbolic notation can be confusing and overwhelming for students. Therefore, consider direct teacher instruction for the fifth step. It is important for the students to become familiar with the summation notation for later statistical work in Common Core Algebra 2, as well as work in upper level statistics classes. Once the students have been introduced to the formula, the students should be allowed to use appropriate tools strategically, i.e., the graphing calculator or spreadsheets, to calculate the standard deviation.
Making Deviation Standard - Page 8
When introducing the summation notation for standard deviation, differentiate between the sigma Σ (for summation) and the sigma σ (for standard deviation) for students.
Making Deviation Standard - Page 9
The Algebra II Journal reflection is in the form of a formative mathematical task. This task can be given as a culminating project for this lesson.
UDL Opportunities:
Principle 1: Provide Multiple Means of Representation
Checkpoint 1.1 Offer ways of customizing the display of information
Checkpoint 1.2 Offer alternatives for auditory information
Checkpoint 1.3 Offer alternatives for visual information
Checkpoint 2.1 Clarify vocabulary and symbols
Checkpoint 2.2 Clarify syntax and structure
Checkpoint 2.3 Support decoding text, mathematical notation, and symbols
Checkpoint 2.5 Illustrate through multiple media
Checkpoint 3.2 Highlight patterns, critical features, big ideas, and relationships
Checkpoint 3.3 Guide information processing, visualization, and manipulation
Checkpoint 3.4 Maximize transfer and generalization
Principle 2: Provide Multiple Means of Action and Expression
Checkpoint 4.1 Vary the methods for response and navigation
Checkpoint 5.3 Build fluencies with graduated levels of support for practice and performance
Principle 3: Provide Multiple Means of Engagement
Checkpoint 7.1 Optimize individual choice and autonomy
Checkpoint 7.2 Optimize relevance, value, and authenticity
Checkpoint 7.3 Minimize threats and distractions
Checkpoint 8.4 Increase mastery-oriented feedback
Checkpoint 9.3 Develop self-assessment and reflection