Making Deviation Standard
 Resources for this lesson:
You will use your Algebra II Journal ![]() on this page.
on this page.
![]() Key Terms
Key Terms
Sample
Population
> Glossary ![]()
> Calculator Resources ![]()
> Teacher Resources: Instructional Notes ![]()
 Andrew: Oh, boy! If we want to find the standard deviation of the years served for all the presidents, that’s 43 data points! This is not going to be fun to calculate by hand.
 Khalid: Never fear! The graphing calculator is here!
Khalid is right. The graphing calculator can find the standard deviation for us very simply!
Re-enter the presidential data for “Number of Years Served” into your graphing calculator. Remember to omit Obama since he was still in office in 2014, and Andrew and Khalid limited their data to 2014.
President |
Number of Terms in Office |
Number of Years Served |
Number of Days Served |
|---|---|---|---|
1. G. Washington |
2 |
6.34 |
2865 |
2. J. Adams |
1 |
4 |
1460 |
3. T. Jefferson |
2 |
8 |
2922 |
4. J. Madison |
2 |
8 |
2922 |
5. J. Monroe |
2 |
8 |
2922 |
6. J. Q. Adams |
1 |
4 |
1461 |
7. A. Jackson |
2 |
8 |
2922 |
8. M. Van Buren |
1 |
4 |
1461 |
9. W. H. Harrison |
1 |
0.08 |
31 |
10.J. Tyler |
1 |
3.92 |
1430 |
11.J. Polk |
1 |
4 |
1461 |
12. Z. Taylor |
1 |
1.33 |
491 |
13. M. Fillmore |
1 |
2.67 |
969 |
14. F. Pierce |
1 |
4 |
1461 |
15. J. Buchanan |
1 |
4 |
1461 |
16. A. Lincoln |
2 |
4.11 |
1503 |
17. A. Johnson |
1 |
3.86 |
1419 |
18. U. Grant |
2 |
8 |
2922 |
19. R. Hayes |
1 |
4 |
1461 |
20. J. Garfield |
1 |
0.54 |
199 |
21. C. Arthur |
1 |
3.46 |
1262 |
22. G. Cleveland |
1 |
4 |
1461 |
23. B. Harrison |
1 |
4 |
1461 |
24. G. Cleveland |
1 |
4 |
1461 |
25. W. McKinley |
2 |
4.5 |
1654 |
26. T. Roosevelt |
2 |
7.5 |
2728 |
27. W. H. Taft |
1 |
4 |
1461 |
28. W. Wilson |
2 |
8 |
2922 |
29. W. Harding |
1 |
2.42 |
881 |
30. C. Coolidge |
2 |
5.58 |
2041 |
31. H. Hoover |
1 |
4 |
1461 |
32. F. D. Roosevelt |
4 |
12.08 |
4422 |
33. H. Truman |
2 |
7.75 |
2840 |
34. D. Eisenhower |
2 |
8 |
2922 |
35. J. F. Kennedy |
1 |
2.83 |
1036 |
36. L. Johnson |
2 |
5.17 |
1886 |
37. R. Nixon |
2 |
5.5 |
2027 |
38. G. Ford |
1 |
2.42 |
895 |
39. J. Carter |
1 |
4 |
1461 |
40. R. Reagan |
2 |
8 |
2922 |
41. G. H. Bush |
1 |
4 |
1461 |
42. W. Clinton |
2 |
8 |
2922 |
43. G. W. Bush |
2 |
8 |
2922 |
44. B. Obama |
2 |
(still completing term in 2014) |
(still completing term in 2014) |
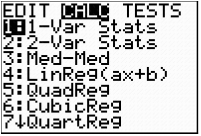
Perform the one-variable statistics calculations again. Your screen should resemble the ones shown below.
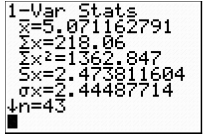
- You already know the symbol
 represents the mean. The symbol is the commonly used symbol for the mean of a data set in many situations.
 - There is another symbol that is used in upper level statistics courses to represent the mean of a set of data. The symbol μ, which is a lower case M (Mu) from the Greek alphabet.
The standard deviation has also been calculated. In the screen shot on the right above there are actually two values that represent the standard deviation of a set of data.
- The symbol
 , which looks like Sx in the viewing window (4th # in the list), is the symbol used to represent the standard deviation of a set of data that is a sample of data from a population of data.
 - The second symbol that is used for standard deviation is
 , which looks like σx in the viewing window (5th # in the list). This symbol is used when the entire population is used in calculating the standard deviation. The symbol
  is from the Greek alphabet and is a lower case sigma.
The data that was entered to determine the 1-Var Stats that are shown in the screen shot above was the entire population. It is appropriate to use the value given forx as the standard deviation. The standard deviation for the number of years our presidents have served is 2.445. This standard deviation is very low, considering there are 43 data points. This means that the data has a low variability and is consistent.
The average president served 5.071 years. The standard deviation is 2.445 years, meaning that the majority of the presidents served an average of 2.445 years more or less than the average 5.071 years.
Now, you try.
 Algebra II Journal: Reflection 2
Respond to the following reflection questions in your Algebra II Journal ![]() and submit to your teacher.
and submit to your teacher.
- Enter in the presidents’ Number of Days Served in your graphing calculator.
- Determine the mean and the standard deviation for the data.
- Provide an interpretation of what the mean and the standard deviation reveal about the context of the situation.