Teacher Resources
Calculator Review
Calculating One-Variable Statistics
Once on the home page, proceed with the following steps:
1. Click Products in the top menu.
2. Click the Calculators & Education Technology link.
3. Click Support in the top menu.
4. Scroll down to the middle of the page under Self-Service Knowledge Base and click Learn More.
5. Click the Product Usage link.
6. Click the TI-83 Family, TI-84 Family, or TI-NspireTM Handheld in TI-84 Plus Mode link.
7. Click the Statistics and Lists link.
8. Type 11927 in the Search box. This is the reference number for the information.
9. Click Search.
10. Under the Solutions heading, click the link for Calculating One-Variable Statistics on the TI-83 Family or TI-84 Plus Family Graphing Calculators.
You may also review instructions in the TI-84 Plus Guidebook. Proceed with the following steps to access the guidebook:
Once on the home page, proceed with the following steps:
1. Click Products in the top menu.
2. Click the Calculators & Education Technology link.
3. Click Downloads in the top menu, and select Guidebooks.
4. Click the Find Your Guidebook link near the bottom of the page.
Finding Mean Absolute Deviation
> MathBits: Measures of Dispersion ![]()
> Math Bits: Measures of Dispersion on Grouped Data ![]()
Creating a Histogram
Follow the instructions above for accessing the Texas Instrument Guidebooks. In the TI-84 Guidebook, you will find instructions for creating a histogram in Chapter 12: Statistics.
Graphing Normal Curves
> MathBits: Normal Probability Distribution ![]()
You may also follow the instructions above for accessing the Texas Instrument Guidebooks. In the TI-84 Guidebook, you will find instructions for graphing normal curves in Chapter 13: Inferential Statistic and Distributions.
Shading Area Under the Normal Curve
> MathBits: Normal Probability Distribution ![]()
You may also follow the instructions above for accessing the Texas Instrument Guidebooks. In the TI-84 Guidebook, you will find instructions for shading area under the normal curve in Chapter 13: Inferential Statistic and Distributions.
Random Number Generator
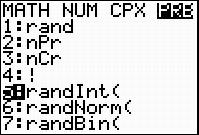
Here are screen shots on how to set up the graphing calculator as a random number generator.
Press MATH, right arrow to PRB, and select 5:randInt( This means a random integer generator. |
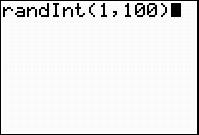
In the randInt( feature, the first number is the lowest number to generate, and the second number is the highest number to generate. randInt(lowest, highest) |
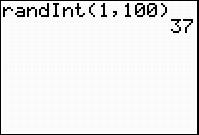
When you press the ENTER button, a number is randomly generated

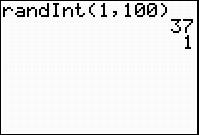
A 37 was generated on this calculator. Press ENTER again. Another number should be generated.


