A Good Enough Fit?
 Resources for this lesson:
You will use your Algebra II Journal ![]() on this page.
on this page.
> Glossary ![]()
> Calculator Resources ![]()
> Teacher Resources: Instructional Notes ![]()
Create and Analyze
In order to make an accurate prediction, Andrew must first create and analyze a scatter plot. To do so, Andrew first created a table of values and let 2007 = year 0.
Years since 2007 |
Winning time (minutes) |
|---|---|
0 |
16.33 |
1 |
16.77 |
2 |
17.5 |
3 |
16.77 |
4 |
16.35 |
5 |
16.42 |
He then created the following scatter plot.
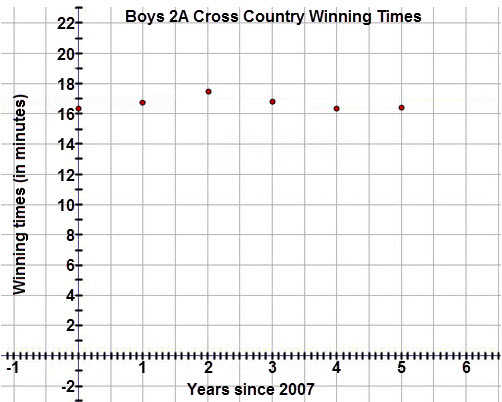
Andrew thinks that the data may be modeled with a linear function.
 Check Your Understanding
Check Your Understanding
Check Your Understanding
 Algebra II Journal: Reflection 1
Now that you have found an equation for line of best fit and made a prediction for the 2014 winning time, it is time to assess the estimated value. Respond to this reflection question in your Algebra II Journal ![]() and submit your reflection to your teacher.
and submit your reflection to your teacher.
How accurate is the estimated winning time for 2014? Why?