Exploring Other Function Models
 Resources for this lesson:
You will use your Algebra II Journal ![]() on this page.
on this page.
> Glossary ![]()
> Calculator Resources ![]()
> Teacher Resources: Instructional Notes ![]()
Why might a quadratic regression equation be a good fit for the data set?
Unlike linear and exponential functions, the quadratic function allows for a change in direction.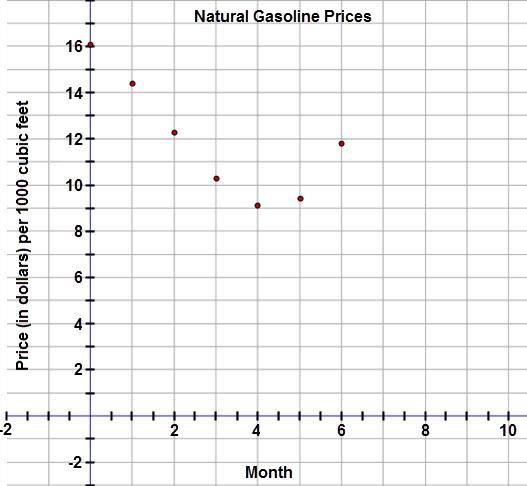
In this data, the price of the natural gas shows a decrease, but after 4 months the price begins to rise. This indicates that a quadratic model would be a better fit than a linear or exponential model.
 Check Your Understanding