Exploring Other Function Models
 Resources for this lesson:
> Glossary ![]()
> Calculator Resources ![]()
> Teacher Resources: Instructional Notes ![]()
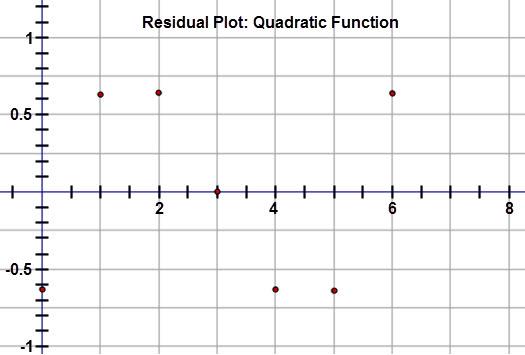
 Khalid: While the residuals are small, there could be a pattern to the residual plot. This indicates that another function could be a better fit for the data set. So, it is important to examine other function families before making a final decision about which model is the best fit.