Just How Normal Are You?
 Resources for this lesson:
> Glossary ![]()
> Calculator Resources ![]()
> Teacher Resources: Instructional Notes ![]()
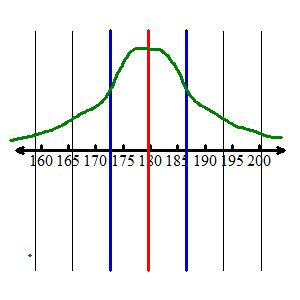
Presidents' Heights
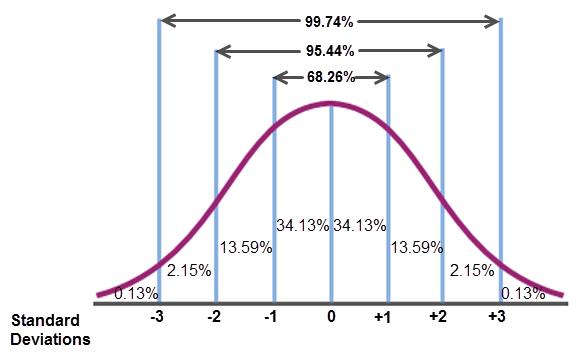
The normal curve creates a visual in which we can estimate different population percentages. Recall the 68-95-99.7 Rule.
Use the Presidents’ Heights normal curve to answer the following questions.
 Check Your Understanding