Just How Normal Are You?
 Resources for this lesson:
> Glossary ![]()
> Calculator Resources ![]()
> Teacher Resources: Instructional Notes ![]()
 Our good friend Khalid wants to know if the graphing calculator can graph a normal distribution. The answer, of course, is yes!
To obtain a graph of a normal distribution, follow these steps using the Rolling Number Cubes data.
 Check Your Understanding
Graphing a Normal Distribution
Click on a box to see the answer.
STEP ONEPress Y =
STEP TWOPress the 2nd button, then VARS (to activate DISTR)
STEP THREESelect 1: normalpdf(
STEP FOUR
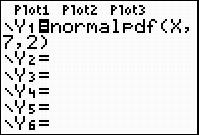
Enter in the following information in the parenthesis: (x, mean, standard deviation). See the screen shot below.
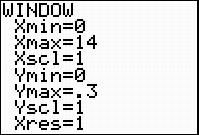
Adjust your WINDOW to display the graph. For the number cube graph, use the WINDOW shown below.
Press GRAPH to see the normal curve for the normal distribution of number cube rolls.
Compare your sketch of the normal distribution with the one on the calculator screen shot in Step Five above.


