Skip to section navigation Skip to main content

A Deeper Look at Exponential Functions

Test and Confirm

image of khalid speakingKhalid: To graph the equation of best fit with the original data set, you need to account for the vertical translation by adding the room temperature to the equation.  So, the exponential equation of best fit for the data set is
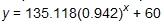
 135 and 118 thousandths times 942 hundredths to the x power plus 60.


This graph is a scatter plot displaying the temperatures of a cup of coffee as it cools over the period of thirty minutes.  The graph is titled ‘Coffee Temperatures.’  The horizontal axis is labeled ‘Time (in minutes)’ and extends from negative 5 to 32.  The vertical axis is labeled ‘Temperature (in degrees Fahrenheit)’ and extends from negative 20 to 240.  The graph displays the following ordered pairs:  (0, 195), (5, 160), (10, 134), (15, 115), (20, 101), (25, 90), and (30, 82).  The curve defined by function g of x = 187.374 times 0.971 to the power of x is drawn through the scatter plot.  The curve defined by the function h of x equals 135.118 times 0.942 to the power of x, plus 60.

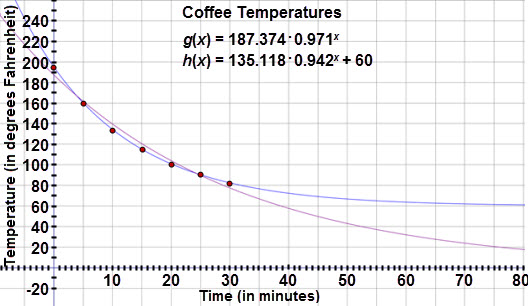
Notice that the new exponential curve is a better fit for the data and shows that the coffee temperature will eventually cool to room temperature.

Examine the residual plot for the adjusted temperature data:

This graph is a residual plot displaying the residuals for the adjusted temperatures of a cup of coffee as it cools over the period of thirty minutes when an exponential regression equation is applied to the data.  The graph is titled ‘Residual Plot: Adjusted Exponential Curve.’  The horizontal axis represents the time (in minutes) and extends from negative 2 to 32.  The vertical axis represents the residual values and extends from negative 1.1 to 1.7.  The graph displays the following ordered pairs:  (0, negative 0.417), (5, negative 0.172), (10, negative 0.10), (15, 0.186), (20, 0.452), (25, 0.006), and (30, negative 0.188).

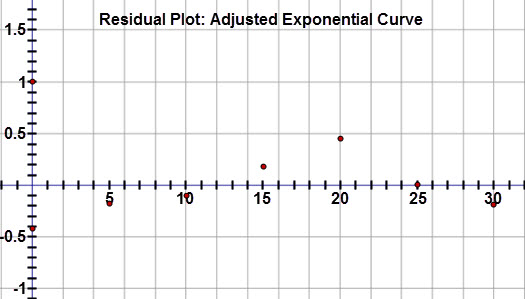
The residual values are close to zero and fairly random.  This confirms that an exponential model is appropriate for this data set.

Apply the Model

Check Your Understanding


< Previous Next >