A Deeper Look at Exponential Functions
 Resources for this lesson:
> Glossary ![]()
> Calculator Resources ![]()
> Teacher Resources: Instructional Notes ![]()
Examine the graph of the exponential model with the scatter plot:
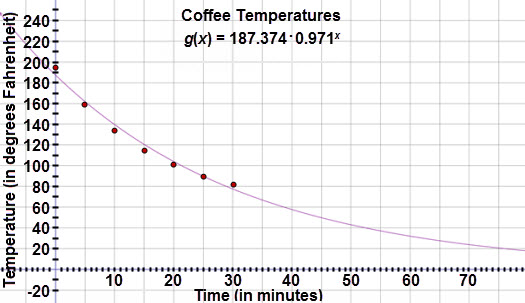
Even though the data should follow an exponential model, the prediction for 60 minutes does not make sense. The temperature indicates that the coffee should be frozen but without any additional cooling agents, the coffee should only cool to room temperature after an hour.
If an exponential curve is the best fit for the data, why is this equation not the best fit?