A Deeper Look at Exponential Functions
 Resources for this lesson:
> Glossary ![]()
> Calculator Resources ![]()
> Teacher Resources: Instructional Notes ![]()
Now that you have reviewed an exponential model, let’s look at another exponential data set.
 Marissa has expanded her science fair project to include an experiment where she examines the rate of change of the temperature of a hot cup of coffee. To collect data for her project, Marissa places a hot cup of coffee in a room that is 60 degrees Fahrenheit. She then records the temperature of the coffee every five minutes during a 30-minute period of time.
Time (in minutes) |
Temperature of Coffee Sample (in degrees Fahrenheit) |
|---|---|
0 |
195 |
5 |
160 |
10 |
134 |
15 |
115 |
20 |
101 |
25 |
90 |
30 |
82 |
Create and Analyze
Examine the graph of the data: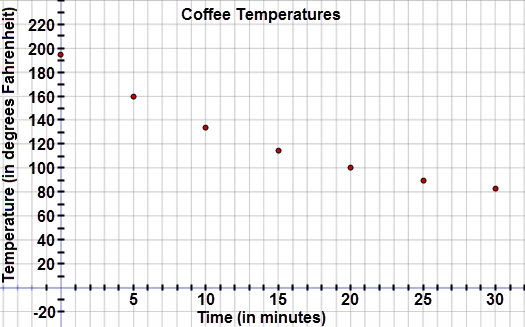
 Check Your Understanding