Modeling With Trigonometric Functions
 Resources for this lesson:
![]() Key Terms
Key Terms
Sinusoidal
Iteration
> Glossary ![]()
> Calculator Resources ![]()
> Teacher Resources: Instructional Notes ![]()
So, Andrew and Marissa researched the average monthly low temperatures for San Diego, California, this past year:
Month |
Month |
Average Monthly Low Temperature (in degrees Fahrenheit) |
|---|---|---|
January |
0 |
48 |
February |
1 |
51 |
March |
2 |
53 |
April |
3 |
56 |
May |
4 |
59 |
June |
5 |
62 |
July |
6 |
65 |
August |
7 |
67 |
September |
8 |
65 |
October |
9 |
61 |
November |
10 |
54 |
December |
11 |
48 |
Data source: http://www.weather.com ![]()
Create and Analyze
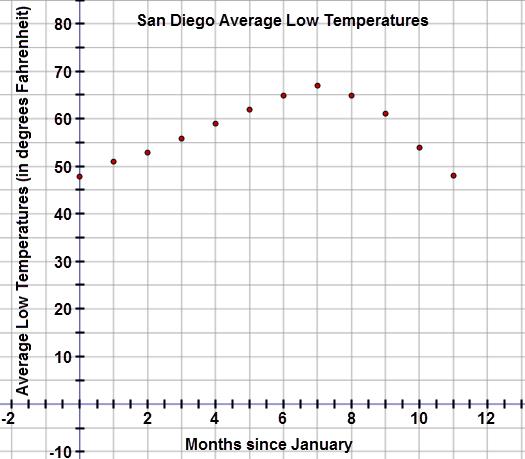
Examine the scatter plot for the data:

Since the data shows the average low temperatures for the past year, it is likely that the temperatures over the next year should follow a similar trend. Because the data is expected to repeat, a trigonometric function is the best fit for the data. In fact, temperature data is the most common application of sinusoidal curves. You may be wondering why there are no cosine or tangent regression equations. Remember, the cosine function is a horizontal translation of the sine curve and the sinusoidal curve accounts for any horizontal translations. Tangent functions have periodic vertical asymptotes and are not good models for most data sets.
Find the sinusoidal equation to model the data set. (The data shows 1 iteration.) Type your equation in the space below. Round coefficients to the nearest thousandth. For any terms that should be subtracted, use the negative sign. Remember to set your calculator to radian mode.
 Check Your Understanding


