Modeling With Trigonometric Functions
 Resources for this lesson:
You will use your Algebra II Journal ![]() on this page.
on this page.
> Glossary ![]()
> Calculator Resources ![]()
> Teacher Resources: Instructional Notes ![]()
 Real-Life Scenarios
> Text version for Real-Life Scenario
Melissa and Andrew researched Boston weather and found the average monthly high temperatures for the past year:
Month |
Month |
Average Monthly High Temperature (in degrees Fahrenheit) |
|---|---|---|
January |
0 |
36 |
February |
1 |
39 |
March |
2 |
45 |
April |
3 |
56 |
May |
4 |
66 |
June |
5 |
76 |
July |
6 |
82 |
August |
7 |
80 |
September |
8 |
72 |
October |
9 |
62 |
November |
10 |
51 |
December |
11 |
42 |
Data source: http://www.weather.com ![]()
Create and Analyze
Examine the scatter plot:
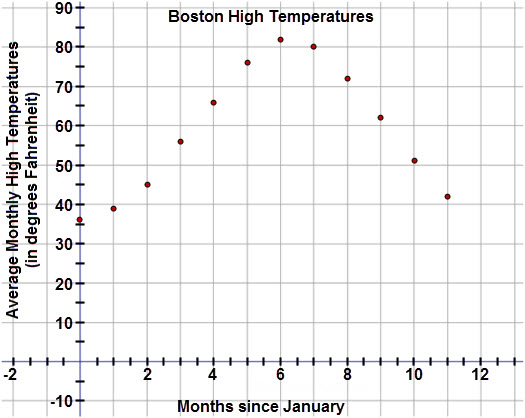
Because the data is expected to repeat, a trigonometric function will most likely be the best fit for the data.
 Check Your Understanding