Plinko
 Resources for this lesson:
> Glossary ![]()
> Calculator Resources ![]()
> Teacher Resources: Instructional Notes ![]()
Here is another situation involving presidents and data sets.
 Khalid and Andrew are getting intrigued about normal distributions and normal curves. They begin to think that any large set of data will result in a normal curve.
They decide to revisit the data on the presidents of the United States, since there are a large number of presidents in that data set.
President |
Number of Terms in Office |
Number of Years Served |
Number of Days Served |
|---|---|---|---|
1. G. Washington |
2 |
6.34 |
2865 |
2. J. Adams |
1 |
4 |
1460 |
3. T. Jefferson |
2 |
8 |
2922 |
4. J. Madison |
2 |
8 |
2922 |
5. J. Monroe |
2 |
8 |
2922 |
6. J. Q. Adams |
1 |
4 |
1461 |
7. A. Jackson |
2 |
8 |
2922 |
8. M. Van Buren |
1 |
4 |
1461 |
9. W. H. Harrison |
1 |
0.08 |
31 |
10. J. Tyler |
1 |
3.92 |
1430 |
11. J. Polk |
1 |
4 |
1461 |
12. Z. Taylor |
1 |
1.33 |
491 |
13. M. Fillmore |
1 |
2.67 |
969 |
14. F. Pierce |
1 |
4 |
1461 |
15. J. Buchanan |
1 |
4 |
1461 |
16. A. Lincoln |
2 |
4.11 |
1503 |
17. A. Johnson |
1 |
3.86 |
1419 |
18. U. Grant |
2 |
8 |
2922 |
19. R. Hayes |
1 |
4 |
1461 |
20. J. Garfield |
1 |
0.54 |
199 |
21. C. Arthur |
1 |
3.46 |
1262 |
22. G. Cleveland |
1 |
4 |
1461 |
23. B. Harrison |
1 |
4 |
1461 |
24. G. Cleveland |
1 |
4 |
1461 |
25. W. McKinley |
2 |
4.5 |
1654 |
26. T. Roosevelt |
2 |
7.5 |
2728 |
27. W. H. Taft |
1 |
4 |
1461 |
28. W. Wilson |
2 |
8 |
2922 |
29. W. Harding |
1 |
2.42 |
881 |
30. C. Coolidge |
2 |
5.58 |
2041 |
31. H. Hoover |
1 |
4 |
1461 |
32. F. D. Roosevelt |
4 |
12.08 |
4422 |
33. H. Truman |
2 |
7.75 |
2840 |
34. D. Eisenhower |
2 |
8 |
2922 |
35. J. F. Kennedy |
1 |
2.83 |
1036 |
36. L. Johnson |
2 |
5.17 |
1886 |
37. R. Nixon |
2 |
5.5 |
2027 |
38. G. Ford |
1 |
2.42 |
895 |
39. J. Carter |
1 |
4 |
1461 |
40. R. Reagan |
2 |
8 |
2922 |
41. G. H. Bush |
1 |
4 |
1461 |
42. W. Clinton |
2 |
8 |
2922 |
43. G. W. Bush |
2 |
8 |
2922 |
44. B. Obama |
2 |
(still completing term in 2014) |
(still completing term in 2014) |
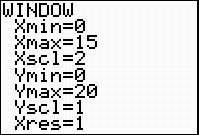 The boys decided to focus on the “Number of Years Served” again (omitting President Obama since he has not completed his term in office). Enter this data into your graphing calculator and construct a histogram. Use the WINDOW shown on the right.
Show AnswerHide Answer
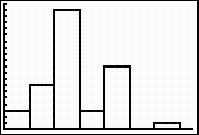 A screen shot of the resulting histogram is shown. There are five bars, a gap, and then one bar. The graph is strongly skewed left.
 Check Your Understanding
The data for the presidents’ years served is not a normal distribution. The data does not form a normal curve. The data is skewed right. This means that there are data values that are much higher than the rest of the data, and could possibly be outliers. (Data that is skewed left contains data values that are much lower than the rest of the data.)
Use the TRACE feature of the calculator to find which president is causing the data to skew to the right.
Show AnswerHide Answer
President Franklin Delano Roosevelt at 12.08 years of service.
Check Your Understanding
Check Your Understanding