Sneaking Statistics
 Resources for this lesson:
> Glossary ![]()
> Calculator Resources ![]()
> Teacher Resources: Instructional Notes ![]()
You have heard these claims before: "Four out of five dentists prefer this toothpaste!"; "Moms agree that this peanut butter is best!"; "Research shows 90-minute classes raise test scores!"
As a member of society, it is important to be wary of such radical claims. A very important skill to have is to know how to evaluate reports based on data.
Here is a diagram of a local Maryland school’s performance on the High School Assessment in 2012.
Maryland High School Assessment Results
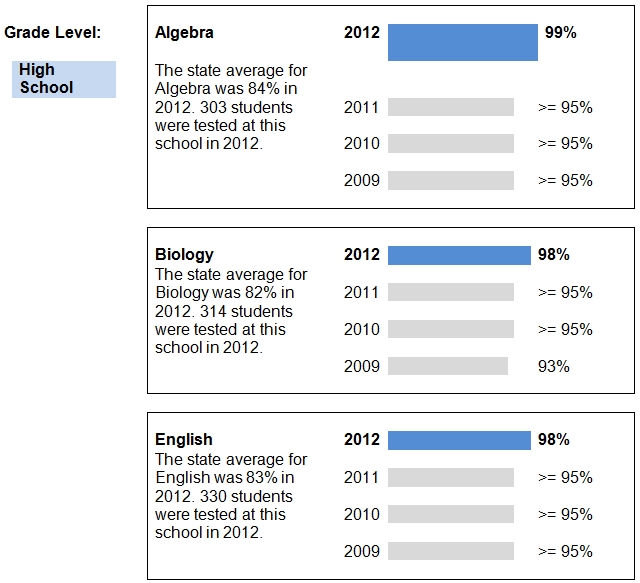
This is all the information that was provided in the website that published this chart. Why is this data table misleading? What information does the table lack that would make it more accurate and less misleading?
Show AnswerHide Answer
This table is misleading because it appears that in the years 2009 – 2011, the school remained steady with their scores. This makes it further misleading because it emphasizes the gain in 2012. The graph also lacks significant labeling as to what the percentages next to the bars represent. In conclusion, not much of a conclusion can be drawn from these graphs! Yet, such graphs can be used by officials to show growth, or lack thereof, in test scores. Again, it is very important for YOU to be aware of when statistics are being manipulated to fool you.