Sneaking Statistics
 Resources for this lesson:
You will use your Algebra II Journal ![]() on this page.
on this page.
> Glossary ![]()
> Calculator Resources ![]()
> Teacher Resources: Instructional Notes ![]()
Not all reports use statistics to mislead the public. Here are some excellent examples of the appropriate use of statistics.
Visit www.businessinsider.com ![]() to see a graph that shows the employment gap between the educated and the uneducated.
to see a graph that shows the employment gap between the educated and the uneducated.
From this graph, it is clear that there is an association between education and unemployment rate. (Remember! Association does not mean causation!)
Not all data has to be in a graph. Here is a table published by techcrunch.com.
This table shows the top grossing apps downloaded. The table is clear, precise, void of extra information, and leaves interpretation up to the viewer.
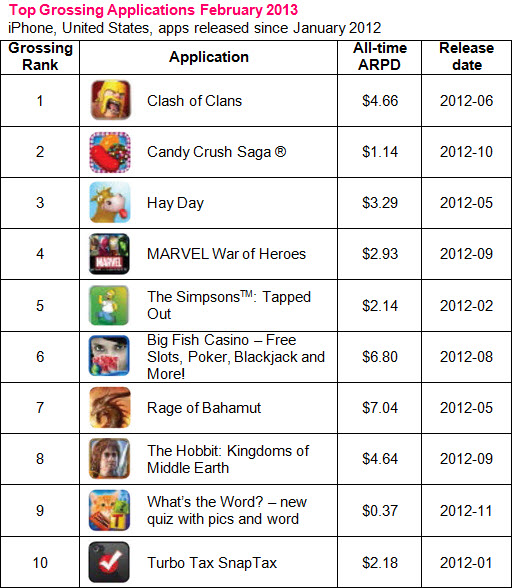
Source: Distimo ![]()
 Algebra II Journal: Reflection 1
Respond to the following reflection activity in your Algebra II Journal ![]() and submit to your teacher.
and submit to your teacher.
- To keep with the weather-related theme of the module, find (or create) a weather-related graph that presents misleading data.
- Reconstruct the graph so that it accurately presents the data.
- Record both graphs. You may use the graphing paper in your journal, your graphing calculator, or other graphing resources in the Calculator Resources section of the website.
- Provide a summary as to what makes the first graph misleading, and how you avoid misleading representations in the second graph.