Skip to section navigation Skip to main content

Which Model Models Best?

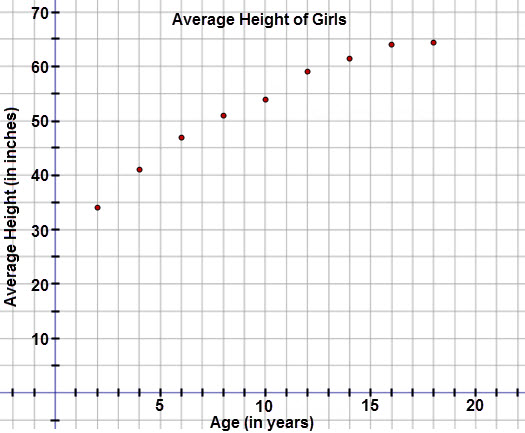
Here is the scatter plot for the data:

This graph is a scatter plot displaying the average height of girls (in inches) based on age.  The horizontal axis is labeled Age (in years) and extends from negative 4 to 22.  The vertical axis is labeled ‘Average Height (in inches)’ and extends from negative 5 to 75.  The graph displays the following ordered pairs:  (2, 34), (4, 41), (6, 47), (8, 51), (10, 54),  (12, 59), (14, 61.5), (16, 64), and (18, 64.5).

Check Your Understanding


< Previous Next >