Skip to section navigation Skip to main content

Which Model Models Best?

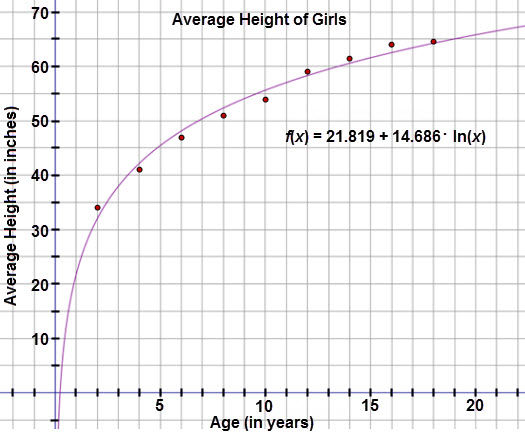
When the logarithmic regression function is graphed on the scatter plot, the function appears to be a good fit for the data.

This graph is a scatter plot displaying the average height of girls (in inches) based on age.  The horizontal axis is labeled ‘Age (in years)’ and extends from negative 2 to 25.  The vertical axis is labeled ‘Average Height (in inches)’ and extends from negative 5 to 75.  The graph displays the following ordered pairs:  (2, 34), (4, 41), (6, 47), (8, 51), (10, 54),  (12, 59), (14, 61.5), (16, 64), and (18, 64.5).  A curve is drawn through the scatter plot, modeled with the logarithmic regression equation f of x = 21.819 + 14.686 time the natural log of x.

Inspection of the residual plot reveals that the residuals are small and relatively random.

This graph is a residual plot displaying the residuals for the average height of girls (in inches) based on age when a logarithmic regression equation is applied to the data.  The horizontal axis represents the age (in years) and extends from negative 1 to 22.  The vertical axis represents the residual values and extends from negative 2 to 3.  The graph displays the following ordered pairs:  (2, 2.0), (4, negative 1.178), (6, negative 1.133), (8, negative 1.358), (10, negative 1.635), (12, 0.687), (14, 0.923), (16, 1.462), and (18, 0.232).

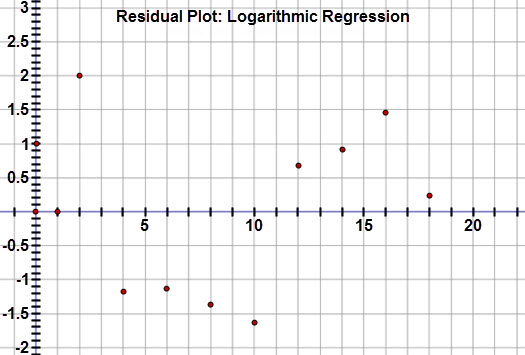
Thus, a logarithmic function is the best model for the data.


< Previous Next >