Making Deviation Standard
 Resources for this lesson:
You will use your Algebra II Journal ![]() on this page.
on this page.
> Glossary ![]()
> Calculator Resources ![]()
> Teacher Resources: Instructional Notes ![]()
In this lesson, you learned about mean absolute deviation and standard deviation. You learned how to calculate these two values, and how they describe the distribution of a data set. In this reflection, you will apply what you have learned in this lesson. Respond to the reflection questions below and submit your reflection to your teacher.
The chart below displays the length of time each president was in service for our country.
President |
Number of Terms in Office |
Number of Years Served |
Number of Days Served |
|---|---|---|---|
1. G. Washington |
2 |
6.34 |
2865 |
2. J. Adams |
1 |
4 |
1460 |
3. T. Jefferson |
2 |
8 |
2922 |
4. J. Madison |
2 |
8 |
2922 |
5. J. Monroe |
2 |
8 |
2922 |
6. J. Q. Adams |
1 |
4 |
1461 |
7. A. Jackson |
2 |
8 |
2922 |
8. M. Van Buren |
1 |
4 |
1461 |
9. W. H. Harrison |
1 |
0.08 |
31 |
10.J. Tyler |
1 |
3.92 |
1430 |
11.J. Polk |
1 |
4 |
1461 |
12. Z. Taylor |
1 |
1.33 |
491 |
13. M. Fillmore |
1 |
2.67 |
969 |
14. F. Pierce |
1 |
4 |
1461 |
15. J. Buchanan |
1 |
4 |
1461 |
16. A. Lincoln |
2 |
4.11 |
1503 |
17. A. Johnson |
1 |
3.86 |
1419 |
18. U. Grant |
2 |
8 |
2922 |
19. R. Hayes |
1 |
4 |
1461 |
20. J. Garfield |
1 |
0.54 |
199 |
21. C. Arthur |
1 |
3.46 |
1262 |
22. G. Cleveland |
1 |
4 |
1461 |
23. B. Harrison |
1 |
4 |
1461 |
24. G. Cleveland |
1 |
4 |
1461 |
25. W. McKinley |
2 |
4.5 |
1654 |
26. T. Roosevelt |
2 |
7.5 |
2728 |
27. W. H. Taft |
1 |
4 |
1461 |
28. W. Wilson |
2 |
8 |
2922 |
29. W. Harding |
1 |
2.42 |
881 |
30. C. Coolidge |
2 |
5.58 |
2041 |
31. H. Hoover |
1 |
4 |
1461 |
32. F. D. Roosevelt |
4 |
12.08 |
4422 |
33. H. Truman |
2 |
7.75 |
2840 |
34. D. Eisenhower |
2 |
8 |
2922 |
35. J. F. Kennedy |
1 |
2.83 |
1036 |
36. L. Johnson |
2 |
5.17 |
1886 |
37. R. Nixon |
2 |
5.5 |
2027 |
38. G. Ford |
1 |
2.42 |
895 |
39. J. Carter |
1 |
4 |
1461 |
40. R. Reagan |
2 |
8 |
2922 |
41. G. H. Bush |
1 |
4 |
1461 |
42. W. Clinton |
2 |
8 |
2922 |
43. G. W. Bush |
2 |
8 |
2922 |
44. B. Obama |
2 |
(still completing term in 2014) |
(still completing term in 2014) |

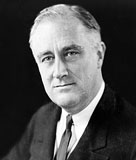
President Franklin Roosevelt
The 22nd Amendment to the Constitution limits the presidential length of service to two terms. This amendment was passed in 1947, during President Harry Truman’s term. This followed President Franklin Roosevelt’s 4 terms, the most of any president of the United States.
Complete the following task to determine how the passing of the 22nd Amendment affected the “Number of Years Served.” Respond to the following reflection questions in your Algebra II Journal ![]() and submit to your teacher.
and submit to your teacher.
- Determine the mean, standard deviation and mean absolute deviation for the first 32 presidents (the presidents who served prior to the 22nd Amendment).
- Which measure of variability, the mean absolute deviation or the standard deviation, represents the distribution of the data best? Use mathematics to explain your answer.
- Determine the mean, standard deviation and mean absolute deviation for the presidents #33 (Truman) to #43 (G. W. Bush). These are the presidents who served after the 22nd Amendment was ratified.
- Which measure of variability, the mean absolute deviation or the standard deviation, represents the distribution of the data best? Use mathematics to explain your answer.
- Compare the mean and variability for the Number of Years the Presidents Served prior to the 22nd Amendment and after its ratification.
- Which data is more variable? Use mathematics to explain how you determined your answer.
- Why do you believe the data set you chose is more variable? Use mathematics to support your answer


