Making Deviation Standard
 Resources for this lesson:
You will use your Algebra II Journal ![]() on this page.
on this page.
> Glossary ![]()
> Calculator Resources ![]()
> Teacher Resources: Instructional Notes ![]()
 Khalid remembers learning about the mean absolute deviation a few years ago in his mathematics class, but he needs some examples to remind himself of how to find the mean absolute deviation. If you also need an example to remind yourself how to calculate the mean absolute deviation, view the following video:
![]() Describe the distribution of data using the mean absolute deviation
Describe the distribution of data using the mean absolute deviation ![]() (from Learn Zillion)
(from Learn Zillion)
In the video, the examples used are very small sets of data. To find the mean absolute deviation for the number of years of presidential service, Khalid will have to work with 43 data points! Instead of calculating the mean absolute deviation by hand, Khalid chooses to use the graphing calculator.
Follow Khalid’s steps in the table below using your graphing calculator.
 Check Your Understanding
Steps for Calculating Mean Absolute Deviation Using the Graphing Calculator
Click each step to read its description.
1. Find the mean of the data set.
a. Enter the data into the calculator.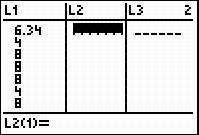
b. Perform a one-variable statistics calculation.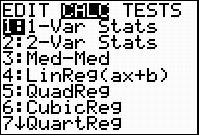
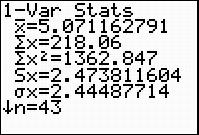
a. Highlight the top of the second column.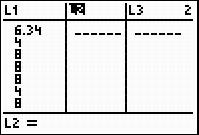
b. Type the following command.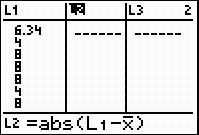

c. Press Enter.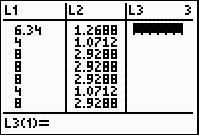
a. Perform a one-variable statistics calculation on the second list.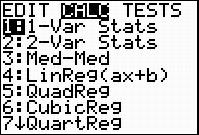
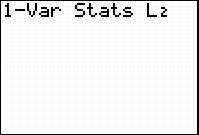
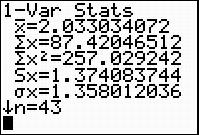
Did you get  , as Khalid did? If not, check to be sure your data is entered in the calculator correctly.
This value, 2.033, is the mean absolute deviation for the number of years our presidents served. This is the average distance each data value is from the mean.
 Real-Life Scenarios
> Text version for animation
Now, you try.
 Algebra II Journal: Reflection 1
Respond to the following reflection questions in your Algebra II Journal ![]() and submit to your teacher.
and submit to your teacher.
- Enter the Number of Days Served for each president in your graphing calculator.
- Using the features of a graphing calculator, determine the mean and the mean absolute deviation of the Number of Days Served by a President data set.
- Explain what the mean and the mean absolute deviation represent in the context of the situation.


