X…Y…Zzzzzzz
 Resources for this lesson:
![]() Key Term:
Key Term:
Percentile
> Glossary ![]()
> Calculator Resources ![]()
> Teacher Resources: Instructional Notes ![]()
Another use of the normal curve is to determine percentiles.The percentages we have discussed so far are NOT the same as the percentiles.
When looking at percentages with the normal curve, consider the entire curve 100%, such that the area under the curve is one whole unit.
Consider the far left 0%, and the far right 100%. (It is very important to understand that the normal curve does not actually intersect the x-axis. The x-axis is an asymptote.) The left and right tails of the normal curve never end.
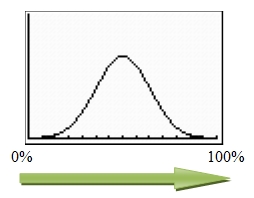
Instead of reading percentages centered about the middle of the curve (i.e., centered about the mean), now look at percentages by reading the curve moving left to right. These are called percentiles.