X…Y…Zzzzzzz
 Resources for this lesson:
> Glossary ![]()
> Calculator Resources ![]()
> Teacher Resources: Instructional Notes ![]()
To clear the shading under the curve for new exercises, press 2nd PRGM to activate DRAW. Choose 1: ClrDraw.
A few moments ago, we heard Justyce explain the following:
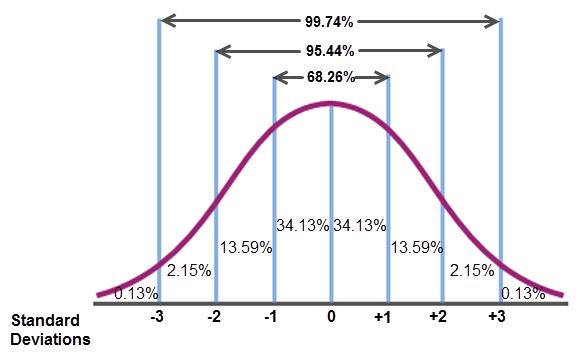
Justyce explains, “Look at the normal curve with those percentages.”
“Those percentages talk about a range of values. For an example let's look at the ages of the presidents at inauguration . The mean age of all of the presidents at inauguration was 54.659 with a standard deviation of 6.186. The 68-95-99.7 Rule, which is also called the Empirical Rule, tells us that in a normal distribution, 68.26% of the values in our data set would fall within one standard deviation of the mean. Since our presidential data was fairly normally distributed, we can say that 68.26% of our presidents were between the ages of 54.659 ± 6.186 years of age at the time of inauguration. The computations for the range of presidents’ ages that fall within one standard deviation of the mean are 54.659 + 6.186 = 60.845 and 54.659 − 6.186 = 48.473. This information allows us to state that approximately 68.26% of presidents were between the ages of 61 and 48 at the time of their inauguration. These percentages can only be discussed with respect to the mean and standard deviation.”
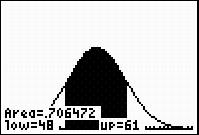
Let’s use what we just learned from the calculator to check these values. Enter the following into the calculator ShadeNorm(48, 61, 54.659, 6.186). Notice the calculator display indicates that the area of the shaded region under the curve is Area = 0.706477. This means that 70.6477% of the presidents were between the ages of 48 and 61 at the time of their inauguration. This value is very close to the 68.26% mentioned in the 68-95-99.7 Rule. If we had not rounded our ages the percentage would have been even closer to 68.26%.
Use the ClrDrw to clear the graph.
Consider President Harrison, who served just 31 days in office. He was 68 years old at inauguration. How does that compare to the other presidents?
- Enter in the calculator ShadeNorm(0, 68, 54.659, 6.186). Here you have just told the calculator to look for presidents 68 years old or younger, which is why you use the 0. Also, recall, the data had a mean of 54.659 and a standard deviation of 6.186.
- Press ENTER.
Did you get .984483? Does this mean 98.4% of the presidents were 68 years old at inauguration? NO! It means that 98.4% of the presidents were 68 years old or younger.
Justyce summarizes this by stating, “President Harrison is in the 98th Percentile. Ninety-eight percent of the presidents were younger than he was, and only 2% were older.”