X…Y…Zzzzzzz
 Resources for this lesson:
You will use your Algebra II Journal ![]() on this page.
on this page.
> Glossary ![]()
> Calculator Resources ![]()
> Teacher Resources: Instructional Notes ![]()
 Andrew: I received my assessment scores back the other day. It said I was in the 73rd percentile. That means that 73% of the people who took the test scored less than I did!
 Khalid: And 27% scored better!
 Check Your Understanding
 Check Your Understanding
 Algebra II Journal: Reflection 1
In this lesson, you estimated areas under normal curves. You utilized the statistical features of the graphing calculator to generate graphs to display areas under normal curves as well as calculated the areas under the curve.
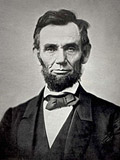
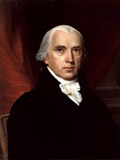
In a previous lesson, Andrew and Khalid researched the different heights of the presidents. They found that the tallest presidents of the United States were Abraham Lincoln and Lyndon B. Johnson. Both of these presidents were 193 centimeters (6 feet 4 inches) tall, and the shortest president was James Madison at 163 centimeters (5 feet 4inches tall).


Through their data analysis, the boys discovered that the heights of the presidents form a normal distribution with mean μ = 179.628 centimeters and a standard deviation  = 6.922 centimeters.
Respond to the following reflection questions in your Algebra II Journal ![]() and submit to your teacher.
and submit to your teacher.
- Use the graphing calculator to construct the normal curve of this normal distribution.
- Create three questions that require someone to utilize the statistical features of the graphing calculator to calculate and analyze the area under the normal curve for the presidents’ heights. Be sure to provide the solutions to your questions.


