X…Y…Zzzzzzz
 Resources for this lesson:
You will use your Algebra II Journal ![]() on this page.
on this page.
> Glossary ![]()
> Calculator Resources ![]()
> Teacher Resources: Instructional Notes ![]()
Let’s use an example to explain percentiles. If you do not already have the presidential inauguration data in your calculator, enter it now (μ = 54.659 and  = 6.186). Graph the normal curve.
On the calculator, press 2nd VARS to activate the DISTR function. Slide to the right to activate the DRAW menu. Select 1: ShadeNorm(.
Enter the following information as prompted by the calculator: ShadeNorm(lower, upper, mean, standard deviation). By “lower,” the calculator is asking “what is the lowest age you want to look at?” By “upper,” the calculator is asking “what is the highest age you want to look at?”
Let’s look at presidents between the ages of 50 and 60. Thus, your calculator screen should look like this: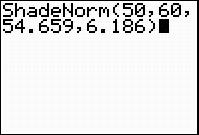
Press ENTER.
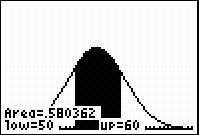
Some very awesome things just happened!
First, did you notice the calculator shaded an area under the curve? That is because when discussing percentiles, we look at the amount under the curve (the entire area under the curve represents 100%).
Second, the calculator tells us what this area is. In this case, we get 0.580362. This means that approximately 58% of the presidents were between the ages of 50 and 60 years old at inauguration.
 Check Your Understanding