Simply Surveying
 Resources for this lesson:
> Glossary ![]()
> Calculator Resources ![]()
> Teacher Resources: Instructional Notes ![]()
Test and Confirm
The girls write the names of the states (removing Maryland) on index cards and place the cards into a hat. Then, they randomly draw ten names of states and record the names of the states in the first column of a table. They find the average yearly snowfall for each of the selected states and record this information in the second column of their table.
State |
Average Snowfall (inches) |
|---|---|
Connecticut |
40.5 |
Texas |
1.5 |
Kansas |
14.7 |
Wyoming |
91.4 |
Montana |
38.1 |
Louisiana |
0.0 |
North Dakota |
51.2 |
Maine |
61.8 |
Vermont |
81.2 |
Kentucky |
12.5 |
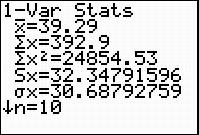
Allyson enters the average snowfall amounts for the selected states into L1 on a graphing calculator. Allyson then determines the mean or average of the “Average Snowfall” amounts for the selected states by using the one-variable statistics capabilities of her graphing calculator. The results are shown below:

 Marissa: Maryland’s average snow fall is 20.6 inches. Thus, Maryland, on average, is below the other states with respect to average amount of snowfall.
 Check Your Understanding


