A Good Enough Fit?
 Resources for this lesson:
> Glossary ![]()
> Calculator Resources ![]()
> Teacher Resources: Instructional Notes ![]()
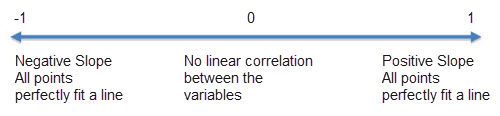
To better assess the model, Andrew also needs to examine the correlation coefficient.
 Check Your Understanding
The correlation coefficient values range from −1 to 1.
Check Your Understanding