A Good Enough Fit?
 Resources for this lesson:
> Glossary ![]()
> Calculator Resources ![]()
> Teacher Resources: Instructional Notes ![]()
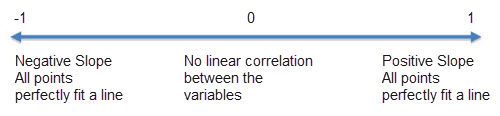
The correlation coefficient indicates the strength of the relationship between the variables. Ideally, the correlation coefficient should be as close as possible to +1 (for increasing linear functions) or −1 (for decreasing linear functions). A correlation coefficient of −0.185 indicates a weak relationship between the variables, so the line of best fit is not an ideal model for the data.
Since the residual plot was random, this indicates that there may not be a curve that will best fit the data. This means that the data does not fit a clear pattern over time. Thus it will be difficult for Andrew to accurately apply a model to the data.