Exploring Other Function Models
 Resources for this lesson:
> Glossary ![]()
> Calculator Resources ![]()
> Teacher Resources: Instructional Notes ![]()
Let’s apply our understanding of functions to the following situation:
 Khalid works on the weekends for his uncle’s gas company. He has been analyzing the average cost the company has charged residents for natural gas over the past six months.
Month |
Price (in dollars) per 1000 cubic feet |
|---|---|
0 |
16.09 |
1 |
14.40 |
2 |
12.26 |
3 |
10.29 |
4 |
9.13 |
5 |
9.41 |
6 |
11.78 |
When presented with a set of data, it is important to find a model that best fits the data in order to make predictions about future trends. For this problem, you will explore how to determine a model of best fit and then use the model to predict the price per 1000 cubic feet of natural gas two months from now (month 8).
When presented with a data set or situation, follow these general steps:
- Create and Analyze: Construct a scatter plot of the data and determine which model(s) may be appropriate for the data. For each potential model, find the equation of best fit.
- Test and Confirm: Analyze the fit of the data for the model using visual inspection, using residuals, and using correlation coefficient (when appropriate). Find and analyze equations of best fit for other potential models to confirm which model best fits the data.
- Apply the Model: Use the model to estimate values or make predictions about future trends.
Create and Analyze
To determine which model(s) may fit the cost of gasoline data, create and analyze a scatter plot, using the Shodor Applet ![]() or using your graphing calculator. Visit the Calculator Resources
or using your graphing calculator. Visit the Calculator Resources ![]() section for information about how to use your calculator and alternative calculator resources for accessibility.
section for information about how to use your calculator and alternative calculator resources for accessibility.
Show AnswerHide Answer
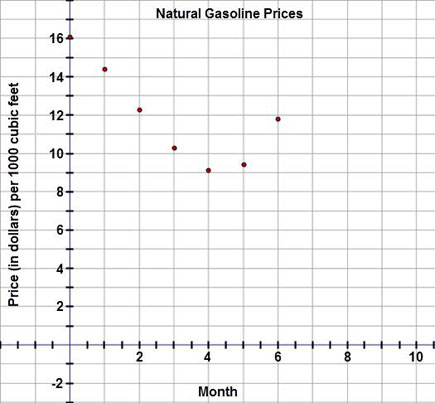 This graph is a scatter plot displaying the price (in dollars) per 1000 cubic feet of natural gasoline over a six month period. The graph is titled 'Natural Gasoline Prices.' The horizontal axis is labeled 'Month' and extends from negative 2 to 10. The vertical axis is labeled 'Price (in dollars) per 1000 cubic feet' and extends from negative 2 to 18. The graph displays the following ordered pairs: (0, 16.09), (1, 14.40), (2, 12.26), (3, 10.29), (4, 9.13), (5, 9.41), and (6, 11.78).
 Check Your Understanding